Determining of the higher valley positions in semiconductors
Majority of semiconductors, when irradiated by femtosecond laser beam, emit short electromagnetic pulses whose Fourier spectra reach far into the terahertz (THz) frequency region. Femtosecond optical pulse interaction with the semiconductor material results in a variety of different physical effects: photocurrent surge in the surface electric field, surface photovoltage due to different excited electron and hole velocities (the photo-Dember effect ), and optical rectification due to the second or third-order nonlinear optical susceptibilities. Therefore, besides of being a source of THz pulses for time-domain spectroscopy systems, THz generation at the semiconductor surfaces can be a valuable tool for investigating various characteristics of the semiconductor itself.
The measurement of the emitted THz pulse amplitude as a function of the femtosecond laser wavelength can be used for the determination of the inter-valley energy separation in the conduction bands. Excitation spectra of THz pulses, increasing femtosecond laser photon energy leads to the enhancement of THz pulse amplitude as long as the photoexcited electron excess energy in the main G valley does not reach the energy position of the subsidiary L or X minima and starts to decrease after the onset of the electron inter-valley transitions that lead to a reduction of the electron momentum relaxation time. Clear maxima in THz pulse amplitude dependences on the femtosecond laser pulse wavelength have been observed in both InAs and InSb, which was used for estimating the inter-valley energy separation in the conduction bands of these semiconductors as equal to 1.08 eV and 0.53 eV, respectively1.
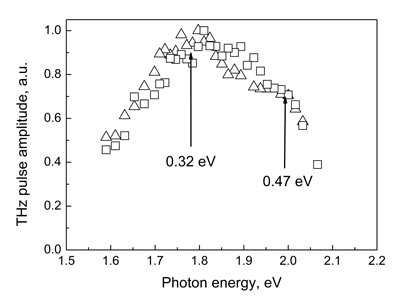
Fig. 1 Inter-valley energy separation determination from THz excitation spectra.
Later on, by using the procedures described above THz excitation spectra were measured on two GaxIn1-xAs samples2: lattice-matched epitaxial layer with x=0.47 grown on InP substrate and Ga0.8In0.2As layer grown on GaAs substrate. If the top of the spectral peaks are flat, it allows separate estimation of Γ-L and Γ-X inter-valley energy separation. Results of these measurements of GaAs are presented on Fig. 1. The values of those material parameters determined by taking into account the non-parabolicity of the conduction band are plotted in Fig. 2 together with the data corresponding to InAs1 and GaAs3. As it can be seen from this Figure, our results suggest that the L and X valleys in InxGa1-xAs are lying at higher energies as it was thought before and their energy position is changing with the composition of the alloy with only small bowing.
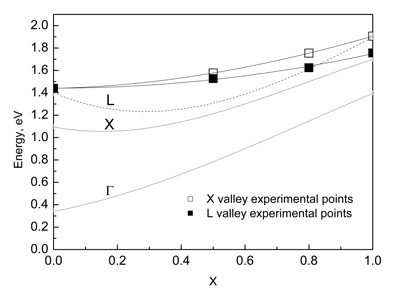
Fig. 2 Energy positions of Γ, X and L valleys in GaxIn1-xAs, versus composition parameter x.
1R. Adomavicius, G. Molis, A. Krotkus, V. Sirutkaitis, "Spectral dependencies of terahertz emission from InAs and InSb", Appl. Phys. Lett., 87, 261101 (2005).
2G. Molis, A. Krotkus, and V. Vaičaitis, "Intervalley separation in the conduction band of InGaAs measured by terahertz excitation spectroscopy", Applied. Physics Letters, 94, 091104 (2009).
3A. Dargys, J. Kundrotas, Handbook on physical properties of Ge, Si, GaAs and InP, Science and Encyclopedia Publishers, Vilnius, 1994.